Wrap Rates 301:
Wrap Rates & Strategic Pricing
Wrap rates are more than numbers. They are indicators of how a company competes and manages itself. Effective contractors use wrap rates as a strategic tool — benchmarking against peers, aligning cost structures with market expectations, and navigating market dynamics. Adjusting rate strategy can drive operational efficiency, shape bid decisions and sustain profitability. When combined with Price-to-Win insight, wrap rates become a financial compass, guiding competitive positioning, profitability, and long-term resilience.
Why Wrap Rates Matter
Wrap rates are more than accounting mechanics: They are a strategic control point linking cost structure, pricing, and competitiveness. A company’s indirect rates signal its operational efficiency, its pricing flexibility, and even its audit maturity. They drive how proposals are evaluated, how profits are sustained, and how management decisions are made:
Operational Efficiency: High wrap rates can indicate indirect cost drag — excess facility overhead, redundant management layers, or underutilized labor. Analyzing rate drivers enables data-backed optimization.
Competitive Pricing: Companies must ensure that their wrap rates are competitive within their market segments. Clear benchmarking against the competition provides cost structure parameters for the company to operate.
Budgeting and Forecasting: Forward pricing rate targets based on industry benchmarks serve as the tops-down backbone of annual budgets. They validate whether growth targets align with indirect rate absorption.
Profitability and Sustainability: Accurate wrap rates ensure full cost recovery. Understated rates may win short-term work but cause significant downstream negative impacts on cash flow and margin across the portfolio.
Compliance and Audit Readiness: Transparent, well-documented rate structures simplify DCAA audits, facilitate FPRRs/FPRAs, and improve cost realism posture and evaluation during competitive procurements.
Ultimately, wrap rates serve as a company’s financial DNA — capturing how efficiently it converts cost into value, how effectively it competes in its market space, and how credible it is in the eyes of the customer and auditor. In an environment where competitiveness and compliance coexist uneasily, disciplined wrap rate governance is not just a necessity of accounting; it is a cornerstone of long-term success in GovCon.
Introducing Price-to-Win (PTW)
While wrap rates reveal your solution costs, Price‑to‑Win (PTW) analysis helps determine what the market will bear. PTW is a strategic process for identifying the target price most likely to win a specific contract by aligning external realities. At its core, PTW integrates several dimensions:
Mission Need: Alignment of mission requirements and the customer’s essential objectives with perceived value from technical approaches.
Budget Constraints: Understanding of the customer’s budget, funding cycle and price sensitivity. A bid doesn’t have to be the lowest to win, but it must fit within what the customer can realistically afford.
Evaluation Criteria: Analysis of how the customer will score proposals — the weighting of cost, technical merit, past performance, and risk. If technical performance carries more weight, there may be more room to price higher and offer more value; If cost/price is critical, then sharper assumptions are required.
Competitor Behavior: Assessment of competitors’ likely capabilities, approaches, and price points.
Effective PTW combines top‑down analysis (IGCE, budget and funding analysis) with benchmarking of comparable transactions and bottoms‑up modeling of competitor solutions. The result is a data‑driven price envelope and recommendation that reflects both the customer’s ability to pay and the competitive field’s likely behavior.
How Wrap Rates and Price to Win Work Together
Wrap rates and PTW are complementary. Your wrap rate forms the baseline cost for your service. PTW looks outward, revealing the target price you need to hit to be competitive. The wrap rate becomes a central pricing lever in PTW modeling. In labor‑intensive contracts, your wrap rate can be the difference between losing and winning. In solution‑driven contracts, where technical approach, integration and materials play a larger role, wrap rates still influence your final price but share the stage with engineering, supply chain and risk decisions.
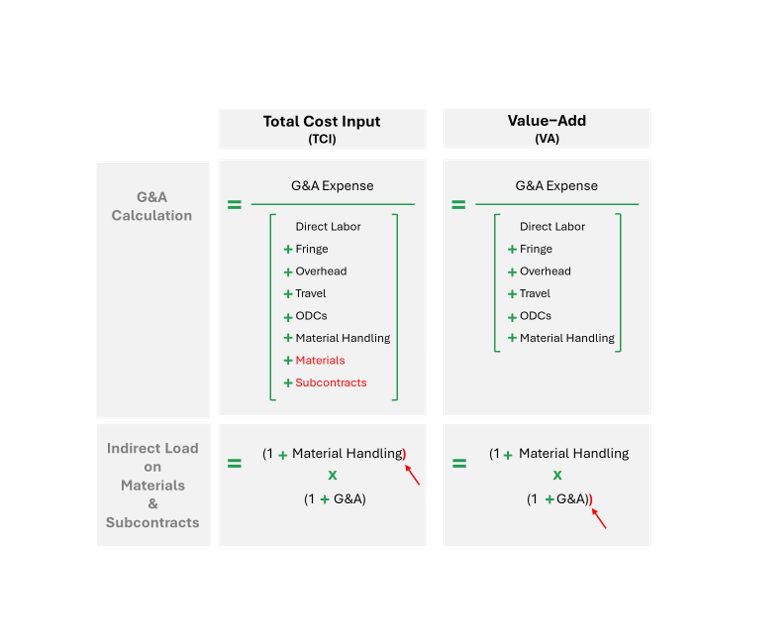
When we talk about wrap rates, we generally discuss a company’s organic wrap rate. In PTW and competitive bidding, wrap rates are better seen as a team wrap rate. The team wrap rate is a weighted wrap rate that is being bid, accounting for proposed workshare agreements, prime and subcontractor organic wrap rates, subcontractor fee and prime costs on subcontractors. The distinction between TCI/VA indirect pools is vitally important to understanding team wrap rates, as this will have significant cost implications on how subcontractors are loaded and — consequently — on the establishment of workshare agreements.

In competitive practice, companies use different strategies for optimizing both their own wrap rates and their team wrap rates at bid time. For PTW, it is important to have a benchmark of what the competitive wrap rates are for the prime and an understanding of the team structure to accurately perform a bottoms‑up modeling of competitor solutions.
Wrap Rate Benchmarking & Market Rates
Government contractors need to know how their indirect rate structures stack up against market peers. Benchmarking compares your wrap rate multiplier to industry norms, historical trends and competitor behaviors. The exercise reveals whether your cost structure is aligned to market conditions and lean enough to win price‐sensitive bids.
For seasoned GovCon finance leaders, benchmarking wrap rates is not merely about checking whether your multiplier falls within a generic range; it is a strategic exercise that dissects the cost architecture of your business and aligns it with evolving industry norms. Advanced benchmarking requires you to look beyond the high-level multiplier and into the specific cost elements. Recent wrap rate trends have reflected that GovCon is an industry that suffers from retaining skilled labor, constantly increasing healthcare costs, and emphasizes operational efficiency. Fringe rates creep up, while OH and G&A rates have trended down. Being out of touch with the market realities of your wrap rate can prove to have dire effects from not being competitive to not being able to effectively manage or retain talent. Mid-size and larger firms are consistently monitoring cost structures to attune to current conditions, especially conscious during times of economic downturns or times of uncertainty.
For Capture executives, understanding your organic wrap rate and team wrap rate impacts not only price competitiveness but also the value that is delivered. Mis-calibrated wrap rates can cause overpriced solutions or cost-slashing to technical solutions that eliminate value your proposal is delivering in order to reach a winning price. Properly identified wrap rate benchmarks can help guide early capture activities and provide color at bid/no-bid reviews.
Benchmarking at this level demands segmentation. You should compare your wrap rates not only to an overall industry average but also to peers in your revenue band, workforce size and line of business. To emphasize this point, client and remote site wrap rates can range anywhere between 1.45-1.90 depending on your segment. Similarly wide ranges can be seen for company-site wrap rates and manufacturing wrap rates.
Sophisticated wrap rate analysis incorporates historical performance, competitive intelligence and advanced financial planning & analysis techniques. Projecting a competitor’s wrap rate utilizes similar techniques as price-to-win. Reverse engineering competitor awards and price points provide direct insight into the overall cost structure of the competitor. Bottoms-up analysis of competitor wrap rates can be completed through the aggregation of publicly available information, such as benefit packages, organizational structure, and contract funding (to name a few). Reconciling the two opposing viewpoints provides for a highly accurate model of a competitor’s wrap rate.
Companies are recommended to keep a consistent benchmark of at least their top 10 competitors, with a minimum of 3 benchmarks for each of their industry vectors. Overlay your fringe, overhead and G&A rates separately against industry medians for similar segments for company-site, client-site and shop/manufacturing work. Compare these models to your own rates to understand where your cost posture provides pricing flexibility or where you may need to pursue structural cost reductions to remain within price‑to‑win ranges.
The ultimate measure of a successful benchmarking exercise is its translation into strategic action. If your wrap rate is above peer norms, develop a road map to streamline indirect costs, which may include consolidating facilities, reevaluating staffing ratios, outsourcing non-core functions or migrating to a value-added G&A base. If your rate is significantly below peers’ rates, ensure that you are not showing chronic under-absorption or not in alignment with FAR and CAS requirements. Integrating benchmarking results into budgeting, forecasting and Price‑to‑Win modelling makes wrap rate benchmarking not just a diagnostic exercise but a proactive tool for driving competitiveness, profitability and compliance.
How to Benchmark Effectively
1. Segment by Business Unit and Worksite: Wrap rates differ by contract environment. Benchmark separate pools (fringe, overhead and G&A) for client site, company site and shop/manufacturing work.
2. Use Industry and Contract Type Data: Competitive wrap rates vary by line of business (e.g., IT services vs. complex systems integration).
3. Reverse engineer: Use recent award data and protest data points to reverse engineer likely wrap rates
4. Model Competitor Structures: Use competitive intelligence to gather company information that will allow for a detailed bottoms-up analysis.
5. Update Benchmarks Regularly: Market conditions and corporate strategies change. Incorporate the latest data and adjust for economic shifts (e.g., labor market tightness) when benchmarking your rates.
Can You Not Bid Your Wrap Rate?
Competitive pressure often forces contractors to consider whether they can — or should — bid below their cost wrap rate. The answer is yes, but with significant caveats. While contractors are not prohibited from proposing indirect rates that differ from their calculated wrap rates, doing so introduces both financial and compliance implications that must be carefully considered.
In some situations, contractors evaluate a new opportunity and view the additional revenue as accretive to their existing indirect rate forecast — meaning the new work would expand the cost base and lower overall rates. In this scenario, the contractor may choose to “expand the base” by increasing the denominators for one or more indirect cost pools, effectively diluting the rate. The risk in doing so is minimal for fixed-labor contracts (FFP, T&M, or LH) if the revenue truly represents new, incremental volume. However, for cost-type contracts, the government almost always requires supporting documentation — such as a Forward Pricing Rate Proposal (FPRP), Forward Pricing Rate Agreement (FPRA), or Forward Pricing Rate Recommendation (FPRR). Section L may additionally require 3-5 years of actual indirect rate history as justification. In these cases, the risk is not in performance but in evaluation: Will the contracting officer accept the realism of the rates? If not, the government will likely make a Most Probable Cost (MPC) adjustment to normalize the proposal. Expanding the pool base can incentivize aggressive rate assumptions. Finance professionals will see a dual benefit: (1) marginal improvement of the expanded base on the rate (i.e., the rate decreases by increasing the denominator) and (2) improving margin on existing FFP, T&M, or LH contracts that remain burdened at the previously higher rates.
In rare cases where a new contract is large enough to materially change the business profile, a contractor may even create a new indirect cost pool. This typically occurs only when the contract is sufficiently significant to qualify as a separate line of business. When creating a new rate pool, the financial/execution risk is relatively low on cost-type contracts, as the contractor will be reimbursed for any cost overruns, which incentivizes aggressive assumptions (although the same evaluation risk remains). On a fixed labor contract (FFP/T&M/LH), there is less incentive for aggressive assumptions as the costs are not being shared over other contracts.
Contractors may also make the strategic pricing decision to not bid certain indirect rates — such as G&A — at the proposal stage. This can be an effective competitive tactic, but it carries significant repercussions. Choosing not to propose G&A on a Firm-Fixed-Price (FFP) contract does not eliminate the cost; it simply affects how it is recovered. The contractor can elect to exclude the contract from their G&A allocation base. However, because CAS 410 and FAR 31.203 require that the allocation base be applied consistently across similar cost objectives, there must be a justifiable reason that is documented. The contractor must demonstrate that the contract does not share the same cost objective as the other work in the base — for example, that it requires minimal corporate management or handling.
In this case, the unrecovered costs are still incurred and redistributed across the remaining portfolio, increasing the G&A rate:
Cost-type contracts have relatively minimal risk as the costs are reimbursed.
Fixed price and fixed labor (T&M/LH) contracts would see an incremental reduction to profit.
Conversely, if the contractor chooses to keep the FFP contract in the G&A base but still does not price G&A at bid, the contract will continue to incur its proportionate share of G&A expenses during execution. The result is less realized profit margin on that specific effort, while the pool G&A rate remains stable. In both cases, the cost must land somewhere, either as a rate impact or as contract-level margin erosion. Understanding this tradeoff is essential to maintaining rate integrity, audit defensibility, and strategic balance across a portfolio that includes both cost-type and fixed-price work.
At the enterprise level, effective wrap rate management is not simply an accounting exercise — it is a strategic lever within the broader Price-to-Win (PTW) framework. Successful contractors treat their wrap rates as dynamic instruments that shape competitive posture, market entry strategy, and margin optimization across their portfolio. In mature pricing organizations, rate strategy is modeled alongside win probability, customer sensitivity, and elasticity of price versus value to determine how much risk the business can responsibly assume. When done correctly, bidding below the wrap rate becomes a deliberate, data-informed decision tied to strategic objectives, not a reactive discount to chase work. The most competitive firms understand that the wrap rate defines the floor of cost reality, but strategic pricing defines how to move above or below that floor in pursuit of sustainable growth.
When to Adjust Your Wrap Rate
Wrap rates are not static. Contractors should regularly review and update them when:
Labor costs change: Wage increases, changes to fringe benefits or significant change in the labor mix that would increase/decrease the proportional labor base.
Overhead expenses fluctuate: New facilities, IT investments, or changes in depreciation schedules.
G&A structure shifts: Corporate reorganizations, mergers or addition of new administrative functions.
Systemic and macro-economic changes occur: Changes that shock the GovCon ecosystem or economic changes such as market down-turns, rapid inflation, tariffs, etc. that may affect underlying cost or revenue assumptions.
Regular updates prevent under‑ or over‑recovery and ensure proposals remain competitive.
Tips for Keeping Your Bids Competitive
1. Start early with PTW: Begin price‑to‑win analysis as soon as you identify an opportunity. Early insights inform whether to pursue the bid and shape your technical and pricing strategy.
2. Update your wrap rate regularly: Review indirect rates quarterly or whenever significant cost changes occur. Accurate rates enable confident pricing.
3. Optimize indirect costs: Evaluate fringe benefits, facilities and administrative expenses for efficiency. Negotiating better rates, outsourcing non‑core functions or adopting remote work can reduce overhead.
4. Benchmark your rates: Compare your wrap rate to industry norms and competitors’ published data. If your rate is high, investigate why; if low, ensure you are not under‑allocating costs.
5. Collaborate across teams: Align capture, PTW/pricing and finance teams. Capture managers gather intelligence; PTW/pricing analysts model scenarios; finance ensures cost data is accurate.
Conclusion
Wrap rates are the cornerstone of profitable pricing in government contracting. They ensure that contractors recover all indirect costs (fringe, overhead and G&A) and maintain sustainable margins. Accurate rates support budgeting, competitive pricing and audit compliance.
Pairing wrap rate analysis with Price‑to‑Win strategies allows contractors to align their cost structure with the market. By understanding both the baseline cost (wrap rate) and the competitive target (PTW), companies can bid wisely — winning contracts that make financial sense and avoiding those that do not. Continuous monitoring of indirect costs, compliance with CAS and FAR, and collaboration between finance and capture teams will keep your wrap rates accurate and your bids competitive.
Let’s discuss your next opportunity!
GET IN TOUCH
We partner with capture teams, pricing leads, and executives who need sharp, strategic insights to gain a winning edge in competitive pursuits.